Email Marketing Statistics: What’s Working (and What’s Not) in 2025

Email marketing statistics in 2025 aren’t just numbers—they’re your competitive edge. If you don’t know what’s working, you’re not marketing—you’re guessing. And in a world where inboxes are packed and attention spans are microscopic, guessing is expensive.
This isn’t just another roundup of stats you’ll skim and forget. We’re diving into the data that actually matters—open rates, click-throughs, conversions—and the brutal truth behind what gets results. Which emails get read? Which land in spam? What trends are shaping the future of email marketing? We’ve got the answers.
General Email Marketing Statistics
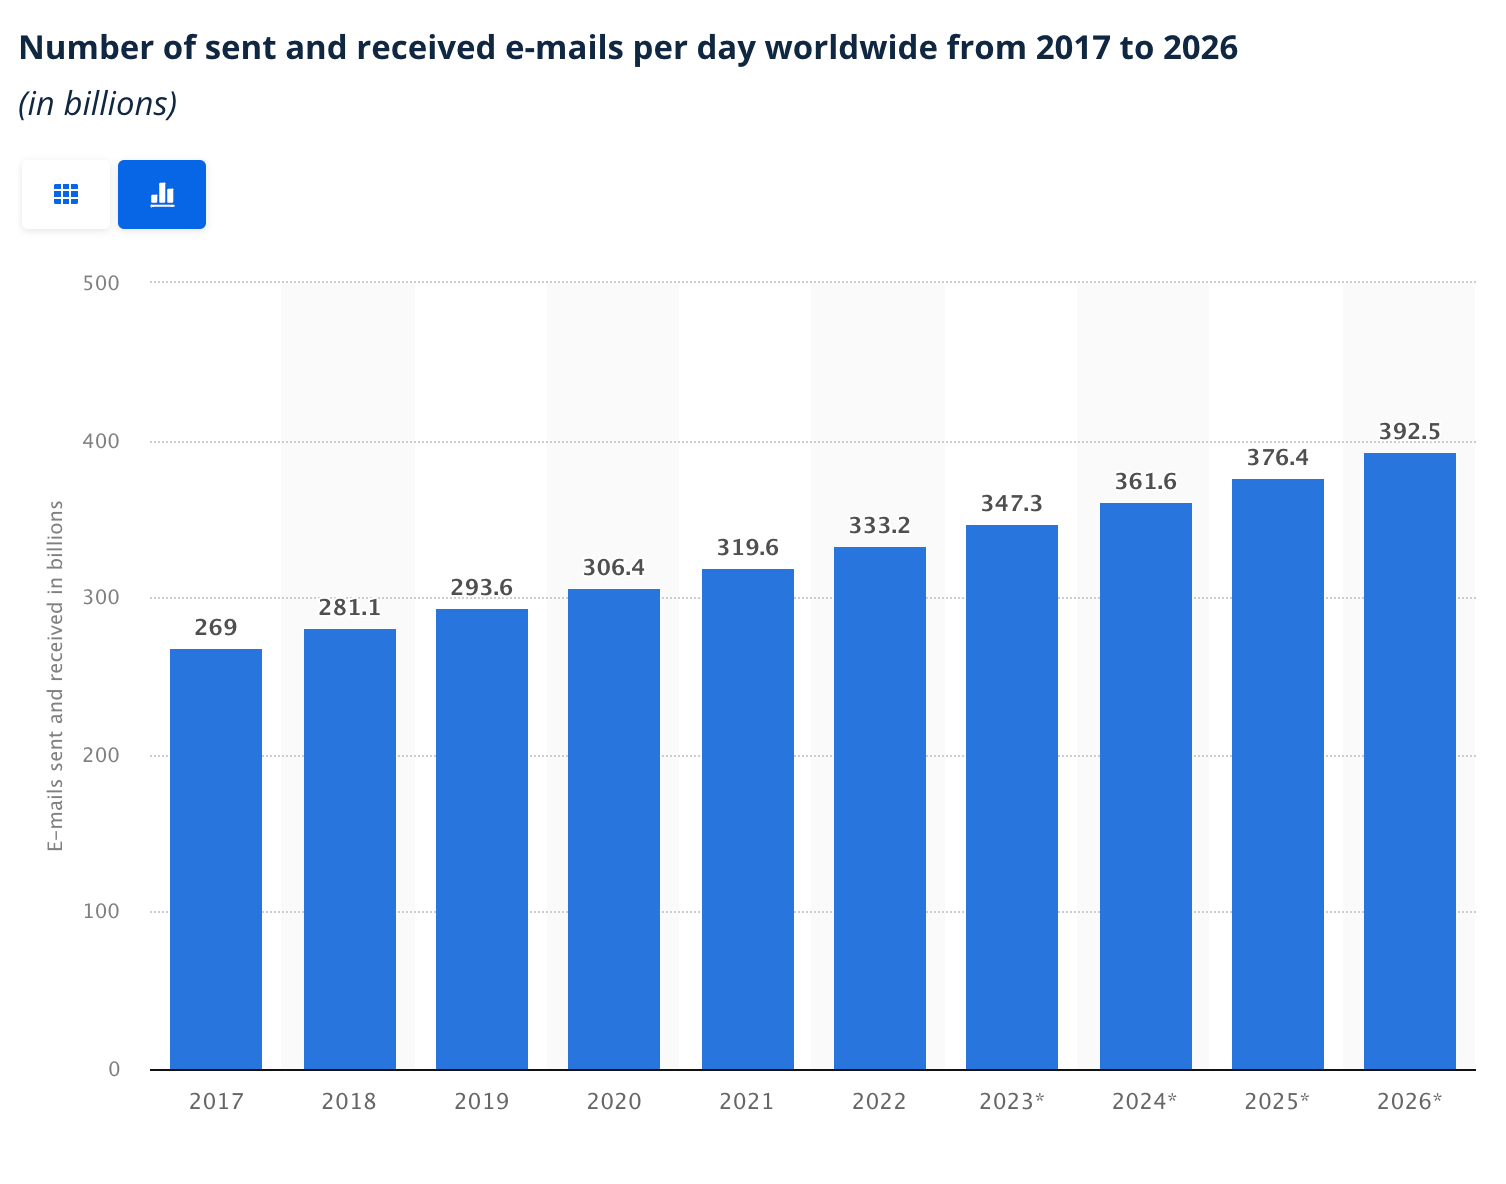
1. Email sent: In 2022, the world saw approximately 333 billion daily emails sent and received. Projections indicate that this number will rise to 392.5 billion daily emails by 2026. (Statista | 2023)
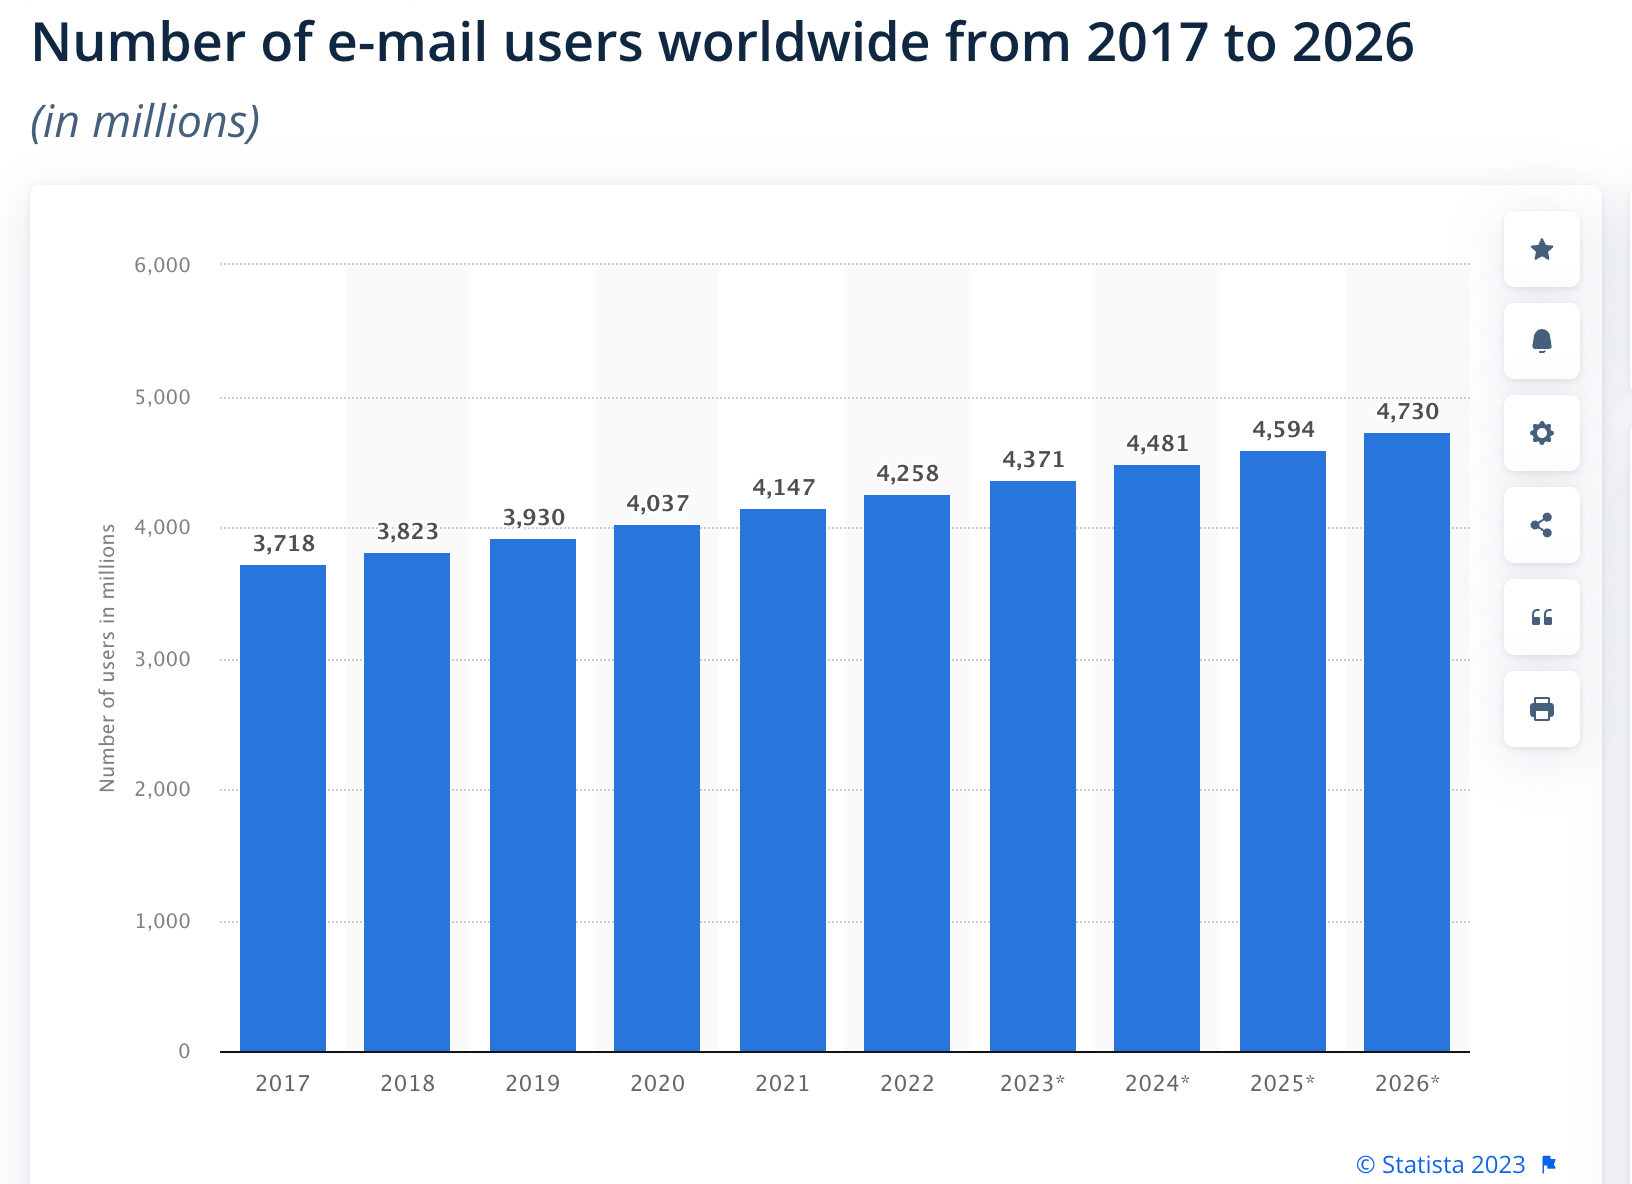
2. Email users: In 2022, the global number of email users reached 4.26 billion and is expected to increase to 4.73 billion by 2026. (Statista | 2023)
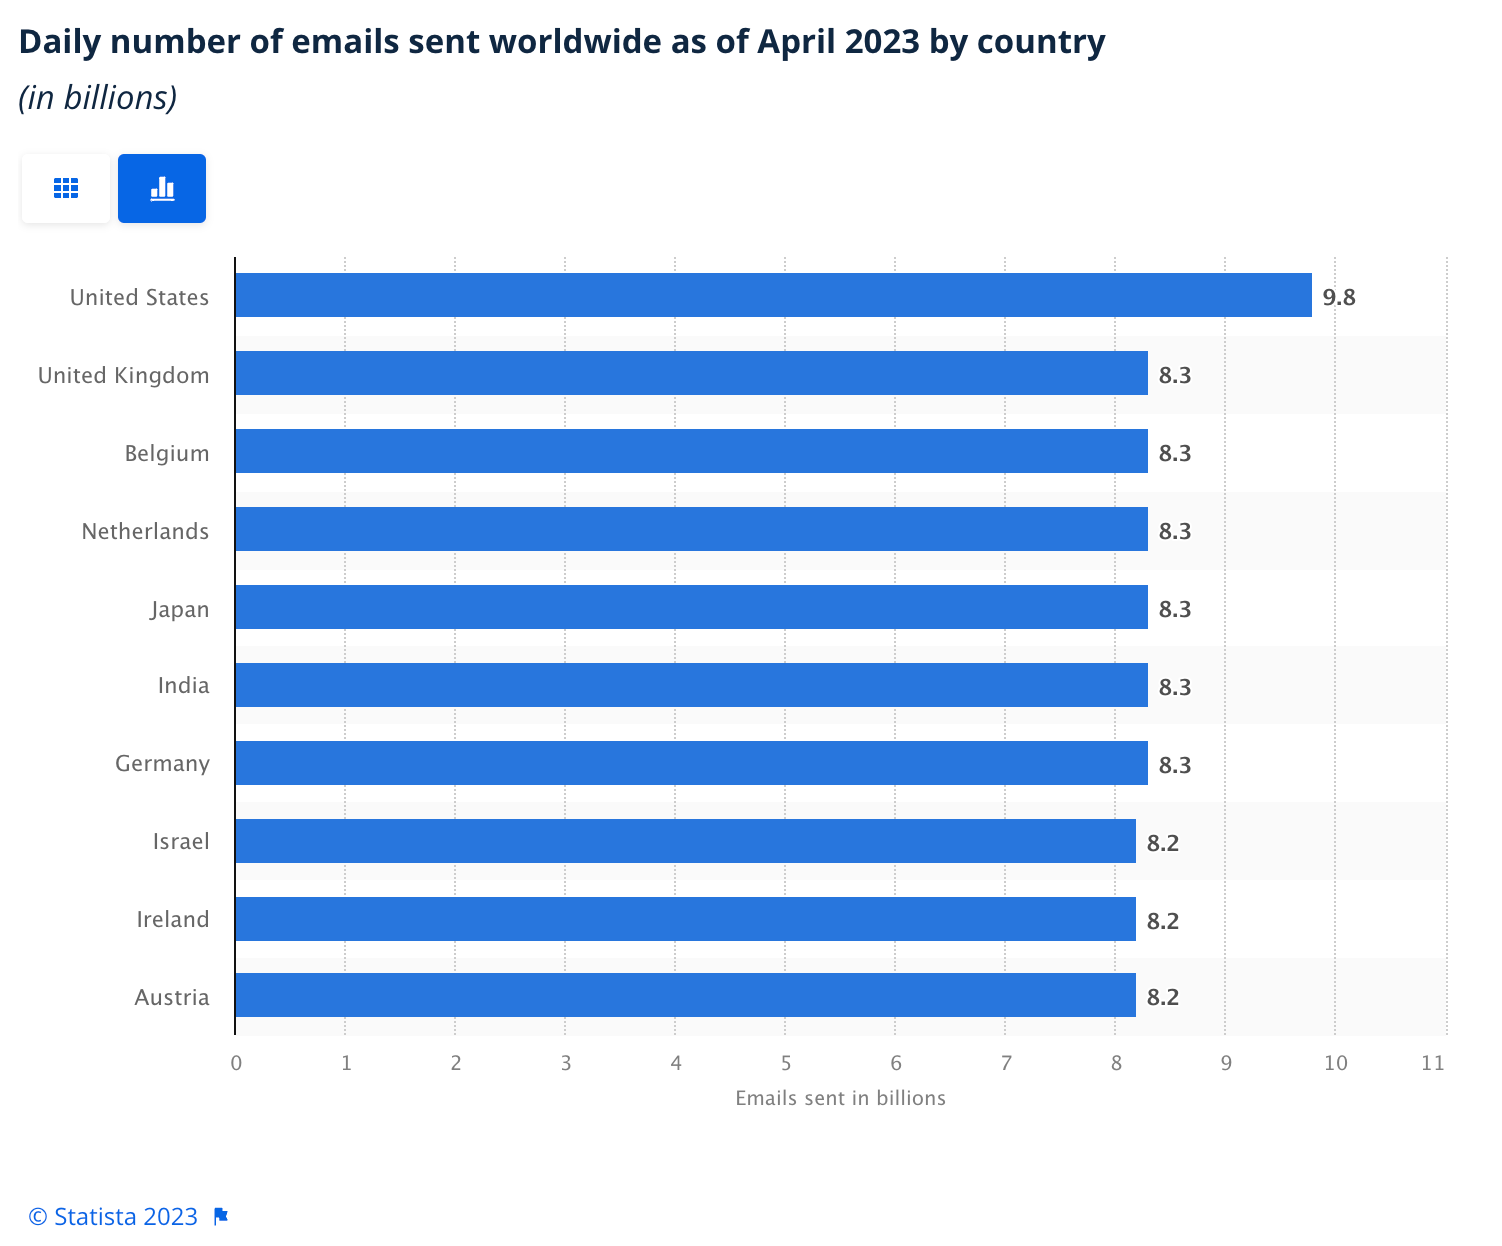
3. Countries and email sent: (Statista | 2023)
- US had 9.8 billion emails sent per day
- UK had 8.3 billion emails sent per day
- India had 8.3 billion emails sent per day
- Japan had 8.3 billion emails sent per day
- Belgium had 8.3 billion emails sent per day
4. Spam emails: In December 2022, spam messages made up more than 45% of email traffic. (Statista | 2023)
5. Email marketing revenue: In 2020, the global email marketing market had a value of 7.5 billion U.S. dollars. The source projected this figure to rise to 17.9 billion by 2027, with an expected compound annual growth rate (CAGR) of 13.3% during that period. (Statista | 2021)
6. Email marketing budget: In a survey conducted between February and March 2022, chief marketing officers at large companies in North America, the UK, Germany, and France revealed that 10.1% of their online marketing budgets were allocated to social advertising. Additionally, 9.8% was dedicated to search, and digital display advertising accounted for 9.3% of online marketing budgets. (Statista | 2022)
Email Open Rates and CTR
7. Open rate: The average open rate for all industries is 21.33%. (MailChimp | 2019)
8. 64% of recipients decide whether to open or delete emails based on subject lines. (Finances Online | 2023)
9. 1/3 of users opt to open emails due to engaging subject lines. (Finances Online | 2023)
Also read: 100+ Email Subject Lines - for Cold Emails, Newsletters, Holiday Greetings, and More
10. The day with the highest email open rates is Monday, with a rate of 22.0%. (Campaign Monitor | 2021)
11. The day with the highest email click-through rate is Tuesday, with a rate of 2.4%. (Campaign Monitor | 2021)
12. Highest click-to-open rates occur on Wednesday and Tuesday, both at 10.8%. (Campaign Monitor | 2021)
Email Deliverability
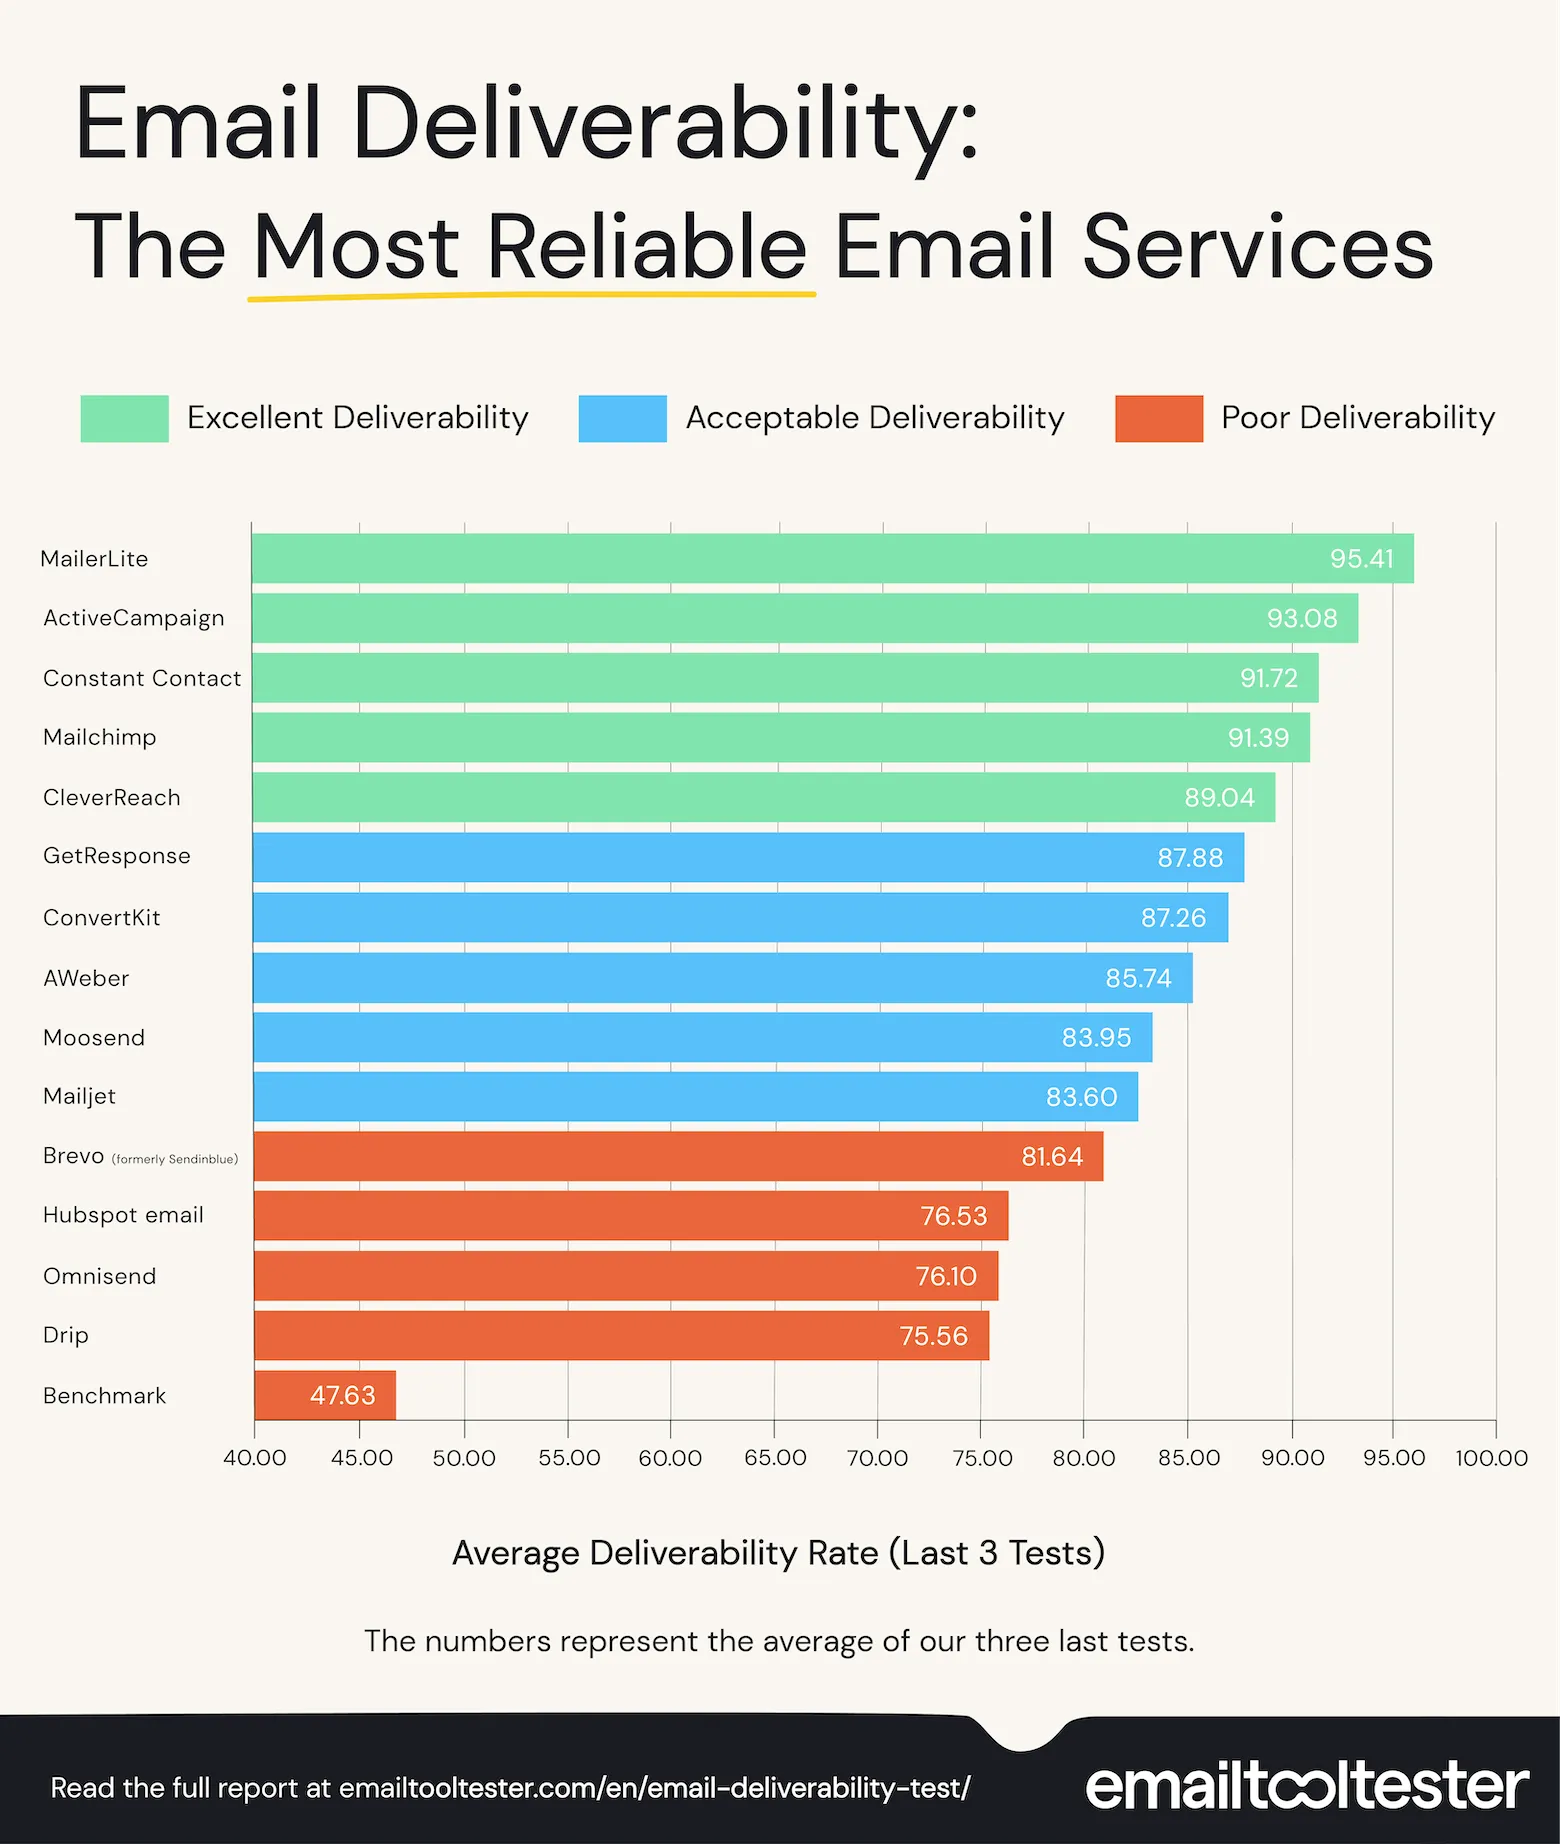
13. The average deliverability rate is 85.7%. That means around 14.3% of emails never reach their intended destination. (emailtooltester | 2023)
14. 89% is considered a good deliverability rate. (emailtooltester | 2023)
15. Deliverability rates from 88 to 83% are considered acceptable. Any rate lower than that is considered poor. (emailtooltester | 2023)
Also read:
Email Personalization Statistics
16. The most effective strategies in email marketing campaigns include subscriber segmentation (78%), message personalization (72%), and email automation campaigns (71%). (HubSpot Blog Research, 2021)
17. In 2022, about 47% of marketing professionals in selected countries globally included subject line personalization in over half of their email marketing campaigns. Additionally, 36% of these professionals did not send any emails with personalized subject lines. (Statista | 2022)
Mobile Email Statistics
18. The majority of email views originate from mobile devices (41%), with desktop views following closely behind (39%). (HubSpot | 2021)
19. Based on a survey of smartphone users conducted between December 2020 and January 2021 across ten global markets, nearly half of the respondents expressed a preference for receiving business communications through email. (Statista, 2021)
20. Implementing a mobile-friendly email layout can boost unique clicks on mobile devices by 15%. (MailChimp | 2021)
21. 56% of marketers incorporate mobile-friendly emails into their email marketing approach. (HubSpot | 2021)
Email Automation Statistics
22. 95% of marketers utilizing generative AI for email creation rate it 'effective,' with 54% considering it 'very effective.' (HubSpot | 2023)
23. 43% of marketers who use generative AI say that it’s most helpful for creating emails. (HubSpot | 2023)
24. 38% of marketers who use AI use it to write emails. (HubSpot | 2023)
25. Among Sales Professionals incorporating AI in their responsibilities, 21% find it most valuable for composing messages to prospects, while 32% consider it most useful for modifying messages to cater to a different audience. (HubSpot | 2023)
26. In a global survey of marketing decision-makers in February 2023, 63% indicated the utilization of automation in their email marketing endeavors. Half of the participants mentioned employing it for social media management, and 40% reported automating their paid advertising efforts. (Statista | 2023)
Email Marketing and AI Statistics
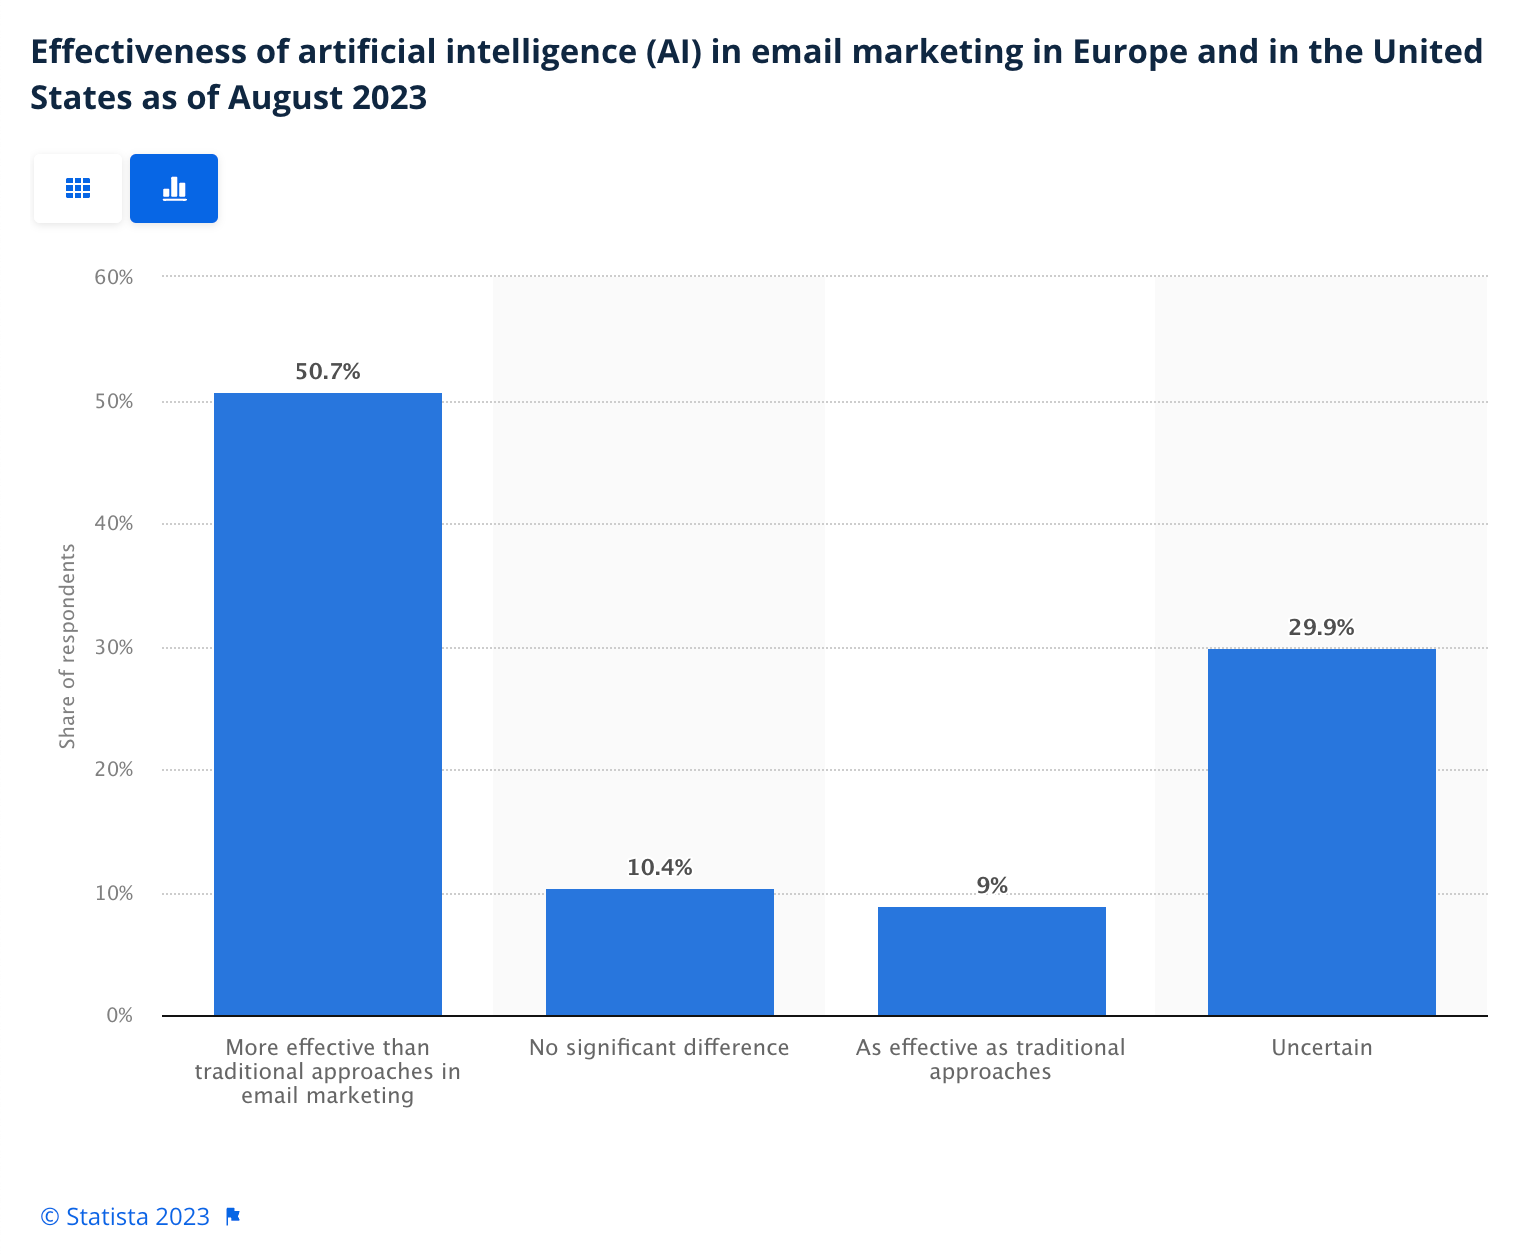
27. In a 2023 survey conducted among email marketers in the United States, the United Kingdom, and other European countries, around 51% of respondents expressed the view that AI-supported email marketing proved more effective than traditional approaches. About 20% observed no significant difference or considered it as effective as traditional methods. (Statista | 2023)
28. In a 2023 survey among email marketers in the United States, the United Kingdom, and other European countries, automatic content and image generation emerged as the most intriguing application of artificial intelligence (AI) in email marketing, cited by about 40% of respondents. Following closely was the personalization of content and newsletters, acknowledged by 34% of those surveyed. (Statista | 2023)
Email Marketing Demographics
29. 35% of respondents in the U.S. possess two email addresses, and 28% have more than four. (Statista | 2021)
30. On average, consumers dedicate 10 seconds to reading emails from brands. (Statista | 2021)
31. 40% of consumers report having a minimum of 50 unread emails in their inbox. (HubSpot | 2020)
32. 64% of Millennials consider email as the most personal communication channel. Additionally, 53% of Millennial Gmail users check the Promotions tab at least once a day. (Bluecore | 2021)
Did We Miss Anything?
The effectiveness of your email marketing campaigns depends on various factors, including your email list, subject line, and the time of day you send them. It's essential to recognize that no two email campaigns are the same.
Therefore, continuous testing is necessary. However, having an understanding of email marketing trends and statistics should aid you in enhancing your campaigns.
Additionally, we've provided an article featuring some of the best cold email templates we've come across. If you need assistance in finding your prospects and creating segmented lists, consider trying the Skrapp Email Finder tool.
FAQs: Email Marketing Statistics
What percentage of email marketing is successful?
Email marketing continues to demonstrate a high return on investment (ROI). On average, businesses can expect an ROI of $42 for every $1 spent on email marketing campaigns. Additionally, the average open rate across all industries is approximately 21.33%.
What is the 80/20 rule in email marketing?
The 80/20 rule, or Pareto Principle, in email marketing suggests that 80% of your results come from 20% of your efforts. This means that a small segment of your email list—typically your most engaged subscribers—drives the majority of your campaign's success. Focusing on this segment can enhance overall effectiveness.
How effective is email marketing?
Email marketing remains a highly effective channel. In 2025, it's projected that close to 380 billion emails will be exchanged daily, reflecting a 14% year-over-year growth.
Furthermore, 60% of consumers report making a purchase as a result of a promotional email.
What are the 5 T's of email marketing?
The 5 T's of email marketing are:
- Tease: Craft compelling subject lines to pique curiosity.
- Target: Segment your audience for personalized content.
- Teach: Provide valuable and educational information.
- Test: Experiment with different strategies to optimize performance.
- Track: Monitor metrics to measure success and inform future campaigns.